Sunday 29 September 2013

INSERT common values into EXISTING TABLE

create table #t2 (id int,name varchar(10))
-----------------------------------------------------------
alter PROC usp_commonvalues
AS
BEGIN
truncate table #t2
DECLARE  @t table (id int,name varchar(10))
insert into @t values(1,'a'),(3,'c'),(2,'d'),(4,'e')
DECLARE  @t1 table(id int,name varchar(10))
insert into @t1 values(1,'b'),(4,'e')
DECLARE @id INT
DECLARE @name VARCHAR(10)=''
DECLARE @i INT=1
DECLARE @count INT
SELECT @count=max(ID) FROM @T
WHILE(@i<=@count)
BEGIN
DECLARE @ID1 INT
DECLARE @NAME1 VARCHAR(10)=''
SELECT @NAME=NAME FROM @t WHERE id=@i
DECLARE @J INT=1
DECLARE @CNT INT
SELECT @CNT=max(ID) FROM @t1
WHILE(@J<=@CNT)
BEGIN
SELECT @NAME1=name,@ID1=id FROM @t1 WHERE id=@J
IF(@name=@NAME1)
BEGIN
INSERT INTO #t2(id,name) select id,name from @t1 where id=@J
END
SET @J=@J+1
END
set @J=1
SET @i=@I+1
END
select * from #t2
END

--EXEC usp_commonvalues

Friday 20 September 2013

EXECUTE PROCESS TASK in BIDS(SSIS)

EXECUTE PROCESS TASK  and FOREACH LOOP CONTAINERNin BIDS(SSIS)

STEP 1: Create a winRAR file on windows explorer, ONE empty folder for achieve extracted files from zip file.

STEP 2:Drag and drop Execute Process Task, then connect to Foreach Loop Container 


STEP 3: Double click on execute Process Task ,select process -->Executable -->Browse the winRAR.exe ,Arguments e -rar D:\sour.rar (D:\sour.rar---is a zip file path)  after that Working Directory--> browse Folder path  (i.e., empty folder) -->press OK again OK.


step 4: Right click on connection manager (my connection manager is loop) select properties--> go to property expression editor -->select connection string-->in expression  browse fullpath (variable name)  from variables--> press OK, again OK.


STEP 5:
Now debug package .
This is Other Option


FOR EACH LOOP in SSIS


FOR EACH LOOP CONTAINER  IN SSRS-2008R2

STEP1: Create source on windows Explorer

STEP2: Create multiple Text files inside source folder


STEP3: Create a package and add DATA FLOW TASK in control flow, and add a variable by right clicking outside the dataflow task and name it as filepath  .


STEP4: Name=filepath, Scope=package, data Type=String;


STEP 5: drag data flow task inside to For each loop.


STEP 6: double Click on For Each Loop and choose collection -->Browse-->select Source Folder And press OK


STEP 7:  Select Filepath From drop down list then Click OK


STEP 8:  Add flat file source and OLE DB Destination , connect together


STEP 9: DOUBLE click on flat file source then give connection name connection1 -->browse folder and any one text file inside it.


STEP 10: click on columns and it will show preview, and press OK 


 STEP 10: next go to COLUMNS and pres OK


STEP 11: Click on new and in the NEW WINDOW again NEW, then select server name and DATA SOURCE name -->test your connection -->press ok again OK.


STEP 12: name of the table or view: select a table from SSMS ,then go to mappings set columns then press ok


step 13: Now debug it.


Wednesday 18 September 2013

Drilldown Matrix Reports


This is how it looked:

Lets add some child groupings to this report, and explore some visibility toggling features.

Step 1: Right click on the Territory field and add a child group:


Step 2: Choose 'CountryRegionCode' to group by:


Step 3: Your design view would look something like this:


Step 4: Hit preview.

Congratulations - your matrix report is ready.

Lets proceed to see some visibility toggling features

Step 5: Click on the row groups - 'CountryRegionRegion' and select the group properties:
Step 6:  In the visibility pane, check 'Hide' for  'When the report is initially run'
Also, check the 'display can be toggled by this report item' for Territory


Step 7: Select OK and hit preview.
You should be able to toggle the report.


SSRS Expressions


Lets look at a very simple example.

Step 1: Create a report server project and connect to Adventure Works Database. 
Step 2: Add the SalesOrderDetail table with a couple of columns to the Report.


Step 3: In the toolbox, add the table control to the report.


Step 4: Add 3 columns to the report - SalesOrderID, SalesOrderDetailID, OrderQty, LineTotal.


Step 5: Now lets write some expressions. We will display anything in LineTotal cell as Green, if the number is above 2000, else we will display in Red.
Right click on the cell , and select text-box properties.


Step 6: Next to the colr dropdown, there is an Fx button.
Write the below expression.


Step 7 : Click OK and then on the Preview button.
You should be getting the final output as displayed below.


Step 8: Now lets write some expressions to manipulate some data.
Right click on the OrderQuantity Cell and click on expressions.
Enter the below expression and click OK.


Step 9: Click on the preview tab, you should get the below output.


I have demonstrated a very simple use of expressions. However , you can write very complex expressions depending on your business needs. For instance, you can write expressions, to calculate the standard deviation of so and so , and manipulate results accordingly.

Creating an SSRS parameterized report


Step 1: Modify the query in the dataset, to make PostalCode as a parameter 


Step 2: Once you click OK, go to the parameters folder in  "Report Data" - you will find that @postalcode automatically appears in the "Parameters" Fields.

Step 3: Lets explore more about the parameter. Double click on @postalcode.
This is place, where you configure, how your parameter should behave - should it allow blank values or null values etc.
You can configure the visibility, data-types, default values etc.
Lets leave it as it is for now.


Step 4: Click preview, and enter in a postal code (91370 for example)


Note: Observe that the parameter appears as a text box here.
If you want pre-configured values (in a dropdown), double click on the parameter in "ReportData" --> Parameters (here, @postalcode) and click "Available Values"/"Default value" and click "Get values from a query". You can choose your dataset and corresponding column. Create multiple datasets to suffice your parameter value requirements.

Creating your first SSRS report.


Lets follow a step by step process to create your first Business Intelligence Report.

Step 1: Open Business Intelligence Development Studio (BIDS) (Start --> Microsoft SQL server 2008 --> SQL server Business Intelligence studio

Step 2: Click File --> New project --> Report Server Project Wizard. Give any name and location.


Step 3: Once you click OK, you will be presented with the following screen.


Step 4 : Click Next. Now configure your connection string. I have chosen the type as 'Microsoft SQL server'


Step 5 : In this step, you need to enter the query for the data, that you need the SSRS report to be populated with. You can also use the query builder.


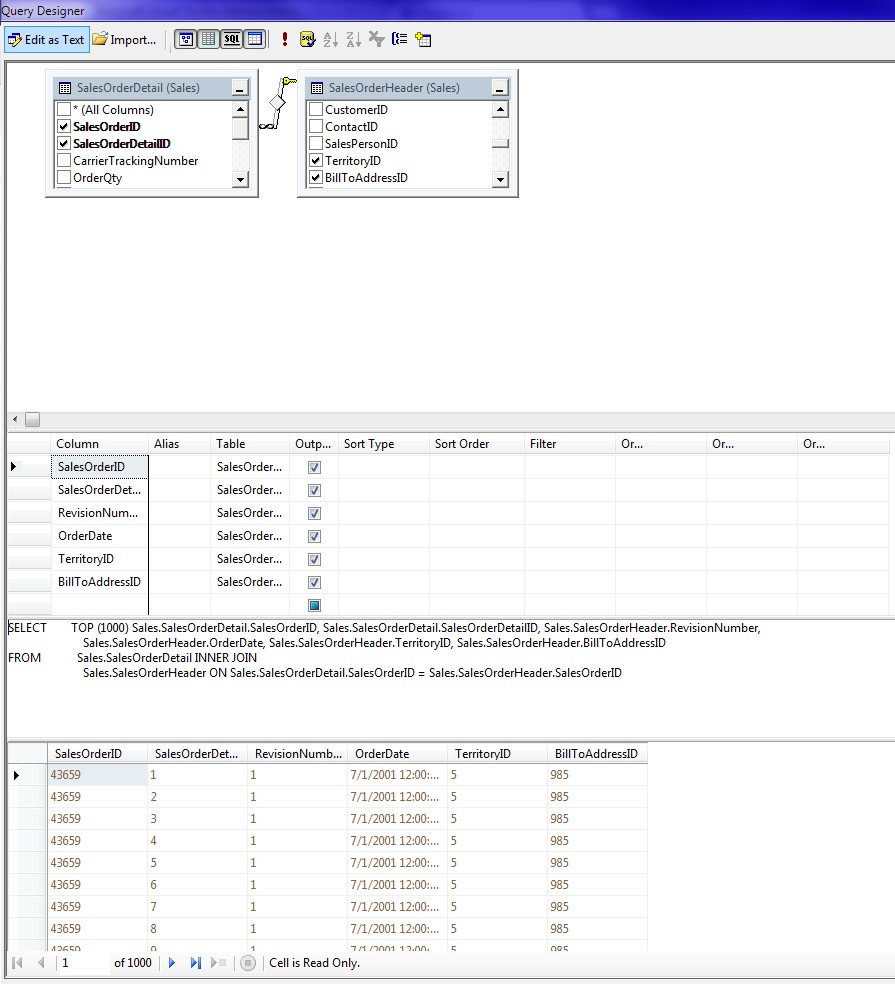
Step 6 : Click on query builder, and click on the right most top icon, to add tables


Step 7: Select the necessary table, and verify your query, then click the (!) icon to see the result of the query after execution.


Step 8: If everything looks good, click on Next


Step 9 :  Click Next


Step 10: Add the fields, as shown in the below screenshot.


Step 11 :  Click next


Step 12 : Choose a style, and click next.


EMP, DEPT Sample script

/****** Object:  Table [dbo].[DEPT]    Script Date: 19-05-2016 06:58:37 ******/ SET ANSI_NULLS ON GO SET QUOTED_IDENTIFIER ON GO SET A...